What is Stathead Hockey?
Stathead includes an incredible collection of hockey research tools. Search any season, game or goal in the history of the NHL, advanced stats, draft info and more.
Player Tools
Look up important NHL history with our Player Game, Season, Streak, and Comparison Finders.
Team Tools
Use our comprehensive Team Game and Streak Finders to dive into your favorite NHL teams.
Advanced Stats Tools
Go beyond the box score with stats like Corsi, Fenwick, PDO, and more.
Draft Tools
Find players drafted within certain criteria, for all NHL Draft years.
Goal Tools
Search every NHL goal and filter by period, situation, scorer, and more.
Stathead Tutorials You Might Find Helpful
Stathead Hockey Webinar
Player Game Finder
Season Finder
Split Finder
Player Comparison Tool
Stathead: The Basics
Searches To Get You Started
Player Game Finder
In the modern era, who scored the most hat tricks in their rookie season?
Use the Player Game Finder to learn that Miroslav Frycer and Teemu Selänne had the most hat tricks as rookies, with 5 each.
Team Streak Finder
Who’s had a longer winning streak than the Panthers’s 14-game streak in 2021?
Use the Team Streak Finder to discover that just five teams have had a longer winning streak than the Panthers’s 14-game streak.
Player Season Finder
Who was the last player to have as many points as Connor McDavid through his age-25 season?
Use the Player Season Finder to learn that Sidney Crosby was the last player to have as many points as Connor McDavid through his age-25 season.
Draft Finder
Who was the last goalkeeper drafted #1 overall?
Use the Draft Finder to see that Marc-Andre Fleury was the last goalkeeper to go #1 overall in the NHL Draft.
Goal Finder
Who scored the most goals against Andrei Vasilevskiy?
Use the Goal Finder to discover that Alex Ovechkin has scored the most goals against Andrei Vasilevskiy with 10.
Team Adv. Stats Finder
What team had the best Corsi For Percentage since 2010?
The Advanced Stats tool shows that the 2020-21 Colorado Avalanche had the best Corsi For Percentage since 2010.
Subscribe To Stathead today and get your first month free!
Choose from all sports, or pick your favorite. Stathead offers monthly and annual subscription options with the ability to cancel at any time. Start diving deep today.
Frequently asked questions
Do you have any other tips and tricks?
What makes Stathead such a powerful research tool is the depth and breadth of our databases, combined with the endless combinations of filters and search criteria at your fingertips. While some searches are straightforward, there's also many "hidden" tricks you can use to get the answer to questions that might seem unanswerable at first glance. Here's a few of our favorites to get you started. Check back frequently as we continue to add to this page.
Search for Team Season Stats
While the Hockey Stathead site does not have a "Team Season Finder" like other sports (though it does have a special team season finder for Advanced Stats), you can still search and filter for team stats by season and across multiple seasons. And it's easy!
1. Go to the Team Game Finder
2. For single-season stats, select "Search for Cumulative Season Games matching criteria" at the top
3. For multi-season stats, select "Search for Cumulative Multi-Season Games matching criteria" at the top
4. Sort By whatever stat you are searching for
5. Apply any other filters you'd like to customize your search
6. Click Get Results!
TIP: If you want to look at a team stat that is not in the Sort By drop-down menu (such as Wins, Losses, Points, etc.), Sort By Season and the default results table will give you those stats.
EXAMPLE: if you want to find the most wins by the Bruins in their first 20 games of the season, follow Steps 1 and 2, Sort by Season, then in the Game Filters, choose Game Number, and enter 1 to 20. Then click Get Results and sort the table by the "W" column.
Can you explain hockey advanced stats?
There are two hockey-specific tools that allow you to search through our advanced stats database going back to the 2007-08 season: Team Advanced Stats Finder and Player Advanced Stats Finder.
These new advanced statistics have helped hockey analysts and fans to better understand the game. Below is a brief summary of the most popular ones.
Corsi and Fenwick
Corsi and Fenwick are similar to the traditional +/- stat, but instead of goals it is based on shots. They attempt to answer the question, "Who is controlling possession of the puck?". Because there aren't possession stats in hockey (yet?) we instead use shots as a proxy, which has been shown to correlate well with puck possession. This can be presented as a +/- stat (i.e. total shots for - total shots against) or as a percentage (i.e. total shots for / (total shots for + total shots against)).
Corsi For (CF) = Shots + Misses + Blocks Against
Corsi Against (CA) = Shots Against + Misses Against + Blocks For
Corsi For % (CF%) = CF / (CF + CA)
Corsi = CF - CA
Fenwick is essentially the same as Corsi, but it excludes blocked shots.
Expected GF/GA and +/-
While Corsi and Fenwick count shot attempts, they don't account for quality of the shot. Expected +/- considers the shot location, and uses league-wide averages to determine the likelihood of that shot being a goal. It doesn't factor in whether the shot actually resulted in a goal or not. Instead, it's giving a sense of shot quality by looking at the odds of scoring a goal from that location.
A team which has an Actual Goal Differential exceeding its Expected Goal Differential ('axDiff') indicates a team converting or stopping an inordinate amount of good chances compared to league average. This could indicate the team has great shooters, a prolific goalie, or is just getting lucky.
A negative differential would indicate a team is getting more good chances than its opponent, but is not converting or is allowing more than league norms. This could mean bad shooting, bad goaltending, or just being unlucky.
Scoring Chances and High-Danger Scoring Chances
As originally defined by War On Ice, 'Scoring Chances' indicate shots attempts that are taken from areas of the ice where goals are more likely to be scored. Attempts made from the attacking team's neutral or defensive zones are excluded.
Inside the zone, a shot is assigned a value of 1,2 or 3, depending on where it was from. A rebound shot (defined as any attempt made within 3 seconds of another blocked, missed or saved attempt without a stoppage in play in between) adds a point to this value. A blocked shot decreases the value by 1.
'Scoring Chances' are any shot attempts with a final value of 2 or higher. 'High-Danger Scoring Chances' are any shot attempt with a final value of 3 or higher.
Can I download the data? If so, how?
We make it easy to download/export the data from all the stats tables on our Reference.com sites and the query results tables from Stathead searches. Here's a quick explainer on how to do it:
- Click on the Export Data link just above the stats and next to the table header (javascript required)
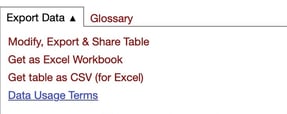
- Choose Get as Excel Workbook (this will automatically download the data table directly to an Excel spreadsheet)
- Choose Get table as CSV (this will convert the table to comma-separated values so you can copy/paste into any spreadsheet program)
Can I share my searches with friends?
We know you want to impress your friends with all the amazing sports knowledge you've gained since getting a Stathead subscription ... so that's why we make it easy to share the results from any Stathead query.
To quickly share any page from a Stathead search query, simply click the purple button "Share Results" at the top of the table:
You'll then get a popup on your screen with a tinyURL for sharing:
Click the "Copy to clipboard" link and then paste the URL into a tweet, text message, Instagram post or whatever form of electronic communication you prefer. And let the trash-talking begin!
We also offer the ability to generate CUSTOMIZABLE tables with a variety of output options such as HTML, a shareable link, reddit-specific markup, an iframe, a js widget, and more.
- Click on the "Export Data" link just above the stats and next to the table header (javascript required):
- Click the red link labeled "Modify, Export & Share Table"
- A sharing toolbox appears and buttons to delete columns and rows appear allowing you to pare the data down to just want you want.
- Please note that any sorting should occur before you delete rows or columns.
- Next select the output option from html, to iframes, to pre-formatted (good for most internet forums) and more
If we don't have the format you want, please contact us.
You are free to use this data anywhere, we would just ask that you include the citation at the bottom of the table as a courtesy to us for providing this service. Please see our Terms of Service and Data Use Policy for more details.
Dive deep into our other Stathead sports - baseball, basketball and football!