What is Stathead Baseball?
Stathead includes an incredible collection of baseball research tools. Search player seasons since 1871, games since 1901, batter and pitching splits, streaks, events, and more.

Season & Career Finders
Find single-season or multi-year totals to create leaderboards by team, position, age, and more.

Game Finders
Find individual games matching a variety of criteria. Includes options for postseason and All-Star games.

Split Finders
Find leaders matching various split criteria. Also used to compare split values to a player's overall total.

Streak Finders
Find streaks of games for teams or players. Includes options for postseason and All-Star games.

Span Finders
Find the best (or worst) statistical spans for any number of games. Seasons option coming soon.

Event Finders
Find individual plays matching a variety of criteria and get a summary line for all matching plays.

Versus Finder
Compare players and teams or see head to head results between teams, players, player vs. team, or batter vs. pitcher.
Stathead Tutorials You Might Find Helpful...
Stathead Baseball Webinar
Player Game Finder
Baseball Season Finder
Split Finder
Player Comparison Tool
Stathead: The Basics
Sample Searches To Get You Started
Batting Season Finder
Who is the only right hand batter besides Hank Aaron to reach 700 career home runs ?

Use the Batting Season Finder to learn that Albert Pujols is the only right-handed batter besides Hank Aaron to reach 700 career home runs.
Pitcher Event Finder
Who was the first Astros pitcher to give up a Home Run in the 2019 season?

Use the Pitcher Event Finder to learn that in 2019, Justin Verlander was the first Astros pitcher to give up a Home Run.
Pitcher Streak Finder
Which pitcher had the longest streak of games with 10+ Strikeouts in 2024?

Use the Pitcher Streak Finder to see that Chris Sale had the longest streak of games with 10+ Strikeouts in 2024 with 3.
Batting Split Finder
Who was the last player before Giancarlo Stanton to have 18 Home Runs in the month of August?

Use the Batting Split Finder to see that Kyle Schwarber's 16 home runs in June 2021 were the most since Sammy Sosa had 20 in June 1998.
Subscribe To Stathead today and get your first month free!
Choose from all sports, or pick your favorite. Stathead offers monthly and annual subscription options with the ability to cancel at any time. Start diving deep today.
Frequently asked questions
Do you have any other tips and tricks?
What makes Stathead such a powerful research tool is the depth and breadth of our databases, combined with the endless combinations of filters and search criteria at your fingertips. While some searches are straightforward, there's also many "hidden" tricks you can use to get the answer to questions that might seem unanswerable at first glance. Here's a few of our favorites to get you started. Check back frequently as we continue to add to this page.
How to find a team's best/worst record through X games of a season
Whether your favorite team gets off to a hot or cold start, it's interesting to track how they're doing compared to past seasons. And there's an easy way to do this using the Team Pitching (or Batting) Game Finder:
1. Go to the Team Pitching Game Finder
2. At the top, select Find Teams with Most Matching Games in a Season
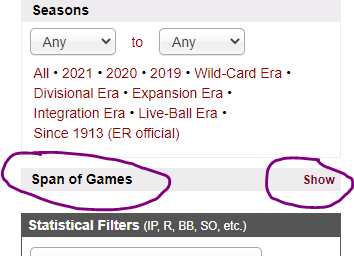
3. On the left side, below the Seasons filter, you'll see a line that says "Span of Games". Click the red text "Show"

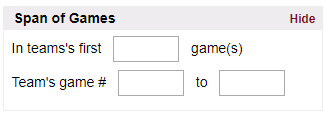
4. Enter the number of games "In team's first ____ game(s)"

5. In Team filters, choose Team and then select the team you want to look at.
6. Click Get Results
7. To find the best/worst record, click on the W-L% column to sort it descending/ascending. To sort chronologically, click on the Year column.
How to find the percentage of runs scored by home runs for a team
2. Select 2021 to 2021 for Seasons

How to find MLB or League-wide splits trends season-by-season
For example, if you want to analyze MLB batting average in April for every season since 1901.
1. Go to Team Batting Split Finder (or Team Pitching Split Finder)
2. Sort by Year
3. In Choose Split Type, select the split trend you want to look at (i.e. Months), then choose the specific split (April).
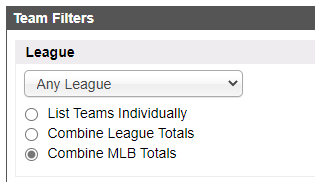
4. In Team Filters, select League, then choose "Combine MLB Totals" (if you want MLB-wide stats) or "Combine League Totals" (if you want AL/NL stats)

5. Click Get Results
Where does your baseball data come from?
Sources
Our baseball data comes from a variety of sources, contributors and collaborators over the years. For those users looking to work with large amounts of data, there are a few free sources that might be useful for users with some programming and/or database experience:
Sean Lahman's Baseball Database
Data Coverage
There is a ton of data available to search and filter with on Stathead.com/baseball. For a complete list of what we do and do not have on the site, including which stats are available for which time periods and when they are missing, please see our comprehensive Data Coverage page on Baseball-Reference.com. On that page you'll find complete information on our full season stats, play-by-play, weather data, pitch data, hit location and batted ball type data.
What is Wins Above Replacements (WAR)?
Wins Above Replacement (WAR) is a player-value metric, an attempt to translate a player's total contribution on the field into a single number, while allowing for comparison across positions, leagues, eras, etc.
Since we added our WAR metric to baseball-reference in 2010, we've seen its use expand into many new areas and its popularity catch on in the media and general population. But there have also been a lot of questions about how it's calculated and whether it has validity.
On baseball-reference.com, we've put together a comprehensive informational guide to WAR, including a very detailed explanation of the calculations used in WAR and an explainer about how our approach differs from some of the other popular WAR or WAR-like metrics.
If you're interested in learning about how to use WAR, the concept of replacement-level players, the changes we've made to our WAR calculations over the years, etc., please go to this link: https://www.baseball-reference.com/about/war_explained.shtml
For a comparison of the different WAR frameworks (i.e. Fangraphs, Baseball Prospectus, etc.), please go to this link: https://www.baseball-reference.com/about/war_explained_comparison.shtml
comprehensive informational guide to WAR
To obtain a daily downloadable archive of our WAR data going back to 2013, please click here: https://www.baseball-reference.com/data/
What are Win Probability Stats?
The Season, Game and Streak Finders each include the ability to search by Win Probability Added (WPA), Base-Out Runs Added (RE24) and Average Leverage Index (LI) stats. The framework for calculating these stats was provided by Tom Tango, author of Inside the Book and the currently the Senior Database Architect of Stats for MLB Advanced Media. More information on his methods can be found in this article.
Win Probability/Expectancy is the percent chance of a team winning the game based on the current score, inning, outs, runners on base, and the run environment. These percentages are calculated using historical data.
Run Expectancy is a similar concept, but instead measures the number of runs a team is expected to scored based only on the number of outs and the position of the runners on base.
Leverage Index is a related concept that measures "how important" the plate appearance is, in relation to determining the outcome of the game.
Additionally, our Pivotal Play Finder, which allows you to search the most "game-changing" plays in MLB history, includes Championship Win Probability Added (cWPA) and Championship Leverage Index (cLI). These stats are similar to the ones above, except that instead of measuring the importance of a particular play to the outcome of that game, they measure the importance of winning that game to a team's chances of winning the World Series.
For more detailed information on Win Probability and its related stats, plus a complete glossary, check out this page on Baseball-Reference.com.
Can I download the data? If so, how?
We make it easy to download/export the data from all the stats tables on our Reference.com sites and the query results tables from Stathead searches. Here's a quick explainer on how to do it:
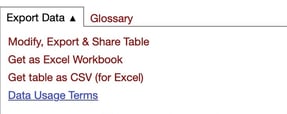
- Click on the Export Data link just above the stats and next to the table header (javascript required)

- Choose Get as Excel Workbook (this will automatically download the data table directly to an Excel spreadsheet)
- Choose Get table as CSV (this will convert the table to comma-separated values so you can copy/paste into any spreadsheet program)
Can I share my searches with friends?
We know you want to impress your friends with all the amazing sports knowledge you've gained since getting a Stathead subscription ... so that's why we make it easy to share the results from any Stathead query.
To quickly share any page from a Stathead search query, simply click the purple button "Share Results" at the top of the table:

You'll then get a popup on your screen with a tinyURL for sharing:

Click the "Copy to clipboard" link and then paste the URL into a tweet, text message, Instagram post or whatever form of electronic communication you prefer. And let the trash-talking begin!
We also offer the ability to generate CUSTOMIZABLE tables with a variety of output options such as HTML, a shareable link, reddit-specific markup, an iframe, a js widget, and more.
- Click on the "Export Data" link just above the stats and next to the table header (javascript required):

- Click the red link labeled "Modify, Export & Share Table"

- A sharing toolbox appears and buttons to delete columns and rows appear allowing you to pare the data down to just want you want.
- Please note that any sorting should occur before you delete rows or columns.
- Next select the output option from html, to iframes, to pre-formatted (good for most internet forums) and more
If we don't have the format you want, please contact us.
You are free to use this data anywhere, we would just ask that you include the citation at the bottom of the table as a courtesy to us for providing this service. Please see our Terms of Service and Data Use Policy for more details.
Dive deep into our other Stathead sports - basketball, football and hockey!


